


Latest News
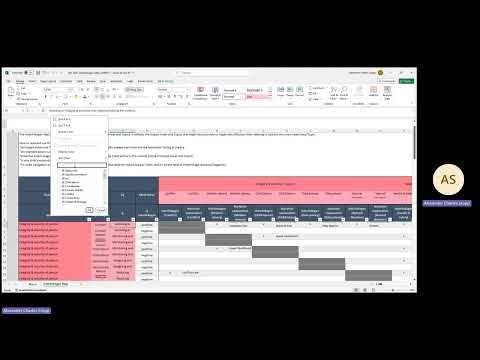
In order to perform Impact Management, it is necessary to understand three elements. First, what is the status of ‘needs’ vis a vis the different Impact Areas or Topics. Second, how one’s activities and/or assets may be positively and/or negatively associated with the Impact Areas or Topics. Third, which are the interlinkages between the different Impact Areas or Topics; that is, how taking action on one Impact Area/Topic might positively or negatively affect other Impact Areas/Topics.
The Impact Mappings are intended to provide a starting point to understand Needs, Portfolio impact associations, and Interlinkages between impact topics. These resources were produced as part of the UNEP FI Tools for Holistic Impact Analysis, in which they are embedded. However, they can also be used independently as input to other processes, methodologies and tools.
The Impact Mappings are live resources which benefit from trialing and refinement as part of the ongoing development process of the UNEP FI Impact Analysis Tools. These resources are refined through an open and ongoing review process, incorporating advancements in the field, user feedback and input from topic experts.
The Sector Impact Matrix has been updated based on the 2026 edition of the Impact Radar. The rest are based on the 2022 edition of the Impact Radar and will be updated in coming months.
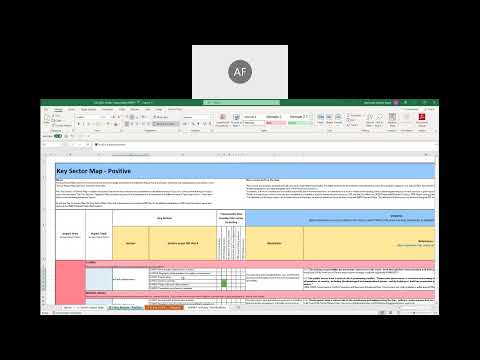
The Sector Impact Matrix identifies the most likely positive and negative sustainability impacts across economic sectors and activities, providing a clear and practical foundation for impact-informed decision-making. It was developed together with peer organizations from the Impact Management Platform.
Find out more here.

Interactive Introduction to the Mappings


For guidance on how to use these resources for your impact management process, please refer to the User Guide to the Impact Mappings.
Feedback
Help us to improve the Impact Mappings! Please share your user experience or any feedback on the Mappings with us. Reach out via this form.
Copyright © United Nations Environment Programme, 2022
The UNEP FI Impact Mappings and Indicator Library may be reproduced in whole or in part and in any form for non-commercial educational or non-profit purposes without special permission from the copyright holder, provided acknowledgement of the source is made. Please contact the United Nations Environment Programme for a tailored acknowledgment statement. The United Nations Environment Programme would appreciate receiving an electronic copy of any materials (publications, resources, tools) that use all or part of these resources either directly or as a source of inspiration.
No use of the Impact Mappings and Indicator Library may be made for resale or for any other commercial purpose whatsoever without prior permission in writing from the United Nations Environment Programme.
Disclaimer
It is our hope that the Impact Mappings will be a source of inspiration to many organizations as they develop their in-house impact management capabilities and/or any advisory services and products on impact management for third parties.
Any resources, tools, systems, products or services developed based on, referring to or otherwise using the Impact Mappings should acknowledge UNEP FI, however, the results, as well as any associated outcomes and decisions made based on such resources, are exclusively attributable to their developers and their own interpretation of the Impact Radar. In no case may these be assumed to be aligned with UNEP FI’s views and methodologies and/or to have been validated, approved or otherwise certified by UNEP FI.
UNEP FI does not provide advisory services or certification for any resources, tools, systems, products or services developed based on, referring to or otherwise using using the Impact Mappings.